(This content was originally published on the Grafana blog.)
“How am I supposed to debug this?”
Just imagine: Late Friday, you are about to shut down your laptop and an issue comes up. Warnings, alerts, red colors. Everything that we, developers, hate the most. The architect decided to develop that system based on microservices. Hundreds of them! You, as a developer, think… why? Why does the architect hate me so much? And then, the sentence: “How am I supposed to debug this?” Of course, we all understand the benefits of a microservice architecture. But we also hate the downsides. One of those is the process of debugging or running a postmortem analysis across hundreds of services. It is tedious and frustrating. Here is an example:
“Where do I start?,” you think. And you select the obvious candidate to start with the analysis: app1. And you read the logs shrinking by time period:
“Nothing. Everything looks normal,” you say. “Maybe, the problem came from this other related service.” And again:
“Aha! I see something weird here. This app2 has run a request to this other application, app3. Let’s see.” And yet again:
Debugging takes ages. There is a lot of frustration until, finally, one manages to figure things out. As you can see, the process is slow. Quite inefficient. Time ago, we did not have logging and traceability in place. Today, the story can be different. Having Grafana Loki, Grafana Tempo and other small tools, we can debug things almost instantly.
Traceability: the feature you need
In order to be able to debug quickly, you need to mark the request with a unique ID. The mark is called Trace ID. And all the elements involved in the request, add another unique ID called span. At the end of the road, you are able to filter out the exact set of traces involved in the request which produced the issue.
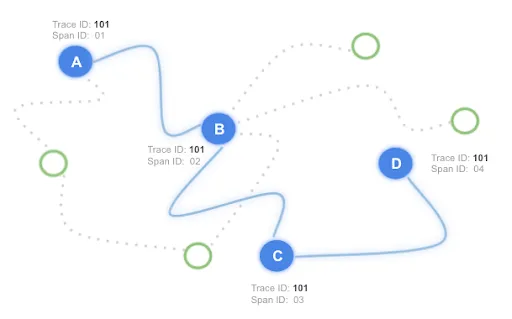
And not only that. You can also draw all this in a visualization to easily understand the pieces which compose your system.
How to do this with the Grafana stack
You are going to do a task simulating a microservices system with a service mesh: Istio. You will say: “Istio offers observability through Kiali.” For observability, Istio relies on Kiali. However, in the world of microservices, we should always show that there are alternatives that could fit the requirements, at least as good as the default ones.
Tempo and Loki are good examples of well-done logging and tracing backends. Regardless the performance comparisons, good points to consider are following ones:
- Tempo and Loki, both, integrate with S3 buckets to store the data. This relieves you from maintaining and indexing storage that, depending on your requirements, might not be needed.
- Tempo and Loki are part of grafana. Therefore, it integrates seamlessly with Grafana dashboards. (Well, being honest here: We all love and use grafana dashboards)
Now, let’s see how you can speed up the debugging process with Istio and the Grafana stack.
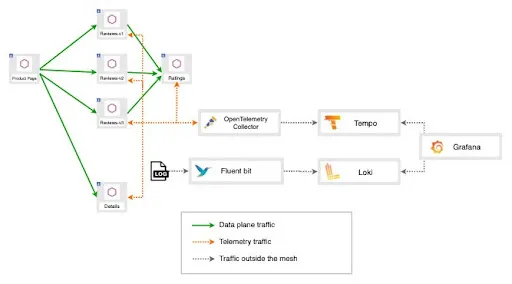
This will be your architecture:
Hands on!
Pre-requisites
- Kuberentes cluster
- Istioctl. The task was developed with v.1.10 (https://github.com/istio/istio/releases)
- Helm (https://helm.sh/)
Prepare Istio
You need to have Istio up and running. Let’s install the istio operator:
Now, let’s instantiate the service mesh. Istio proxies include a traceID in the `x-b3-traceid`. Notice that you will set the access logs to inject that trace ID as part of the log message:
Install the demo application
Let’s create the namespace and label it to auto-inject the istio proxy:
And now the demo application bookinfo:
To access the application through Istio, you need to configure it. It is required a Gateway and a VirtualService:
To access the application, let’s open a tunnel to the Istio ingress gateway (the entry point to the mesh):
Now, you can access the application through the browser: http://localhost:8080/productpage
Install grafana stack
Now, let’s create the grafana components. Let’s start with Tempo, the tracing backend we have mentioned before:
Next component. Let’s create a simple deployment of Loki:
Now, let’s deploy Opentelemetry Collector. You use this component to distribute the traces across your infrastructure:
Following component is fluent-bit. You will use this component to scrap the log traces from your cluster. Note: In the configuration you are specifying to take only containers which match following pattern /var/log/containers/*istio-proxy*.log
Now, the grafana query. This component is already configured to connect to Loki and Tempo:
Test it
After the installations are completed, let’s open a tunnel to grafana query forwarding the port:
Access it using the credentials you have configured when you have installed it:
- user: admin
- password: password
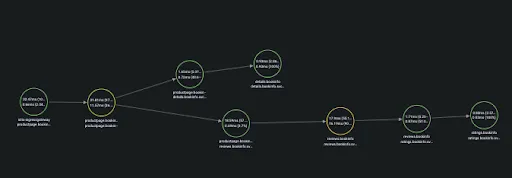
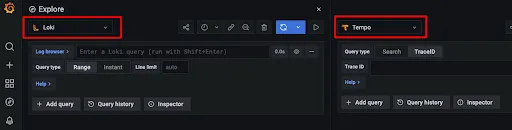
You are prompted to the Explore tab. There, you can select Loki to be displayed on one side and, after click on split, to choose Tempo to be displayed in the other side:

You will see something like this:
Finally, let’s create some traffic with the tunnel we already created to bookinfo application:
http://localhost:8080/productpage
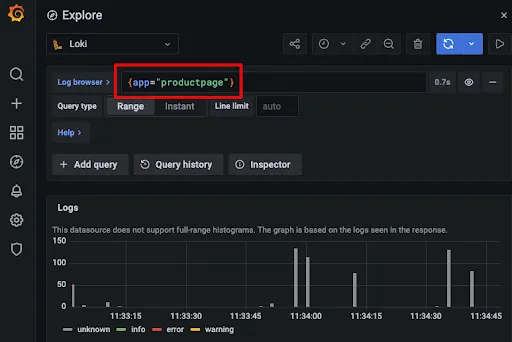
Refresh (hard refresh to avoid cache) the page several times until you can see traces coming into Loki. Remember to add the filter to `ProductPage` to see its access log traces:
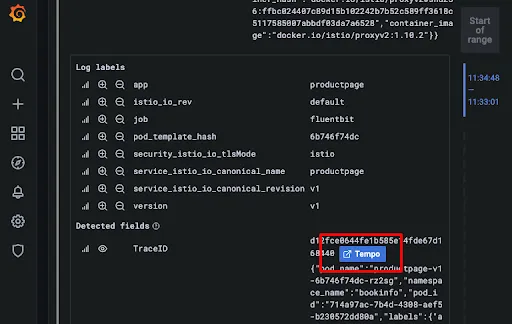
Click on the log and a Tempo button is shown:
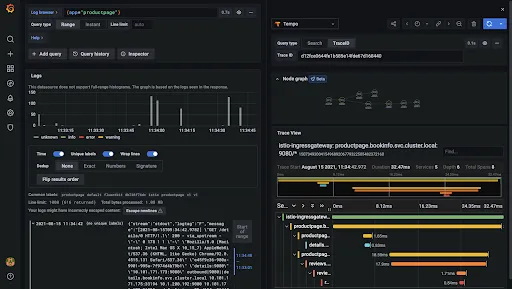
Immediately, the TraceID will be passed to the Tempo dashboard displaying the traceability and the diagram:
Final thoughts
Having a diagram which displays all elements involved in a request through a microservices increases the speed to find bugs or to understand what happened in your system when running a postmortem analysis. Reducing that time, you increase efficiency so that your developers can keep working and producing more business requirements. In my personal opinion, that is the key point: Increase the business productivity. Traceability and, in this case, grafana stack helps you to accomplish that.
Now, let’s make it production ready.


%20a%20Bad%20Idea.png)


%20For%20More%20Dependable%20Humans.png)