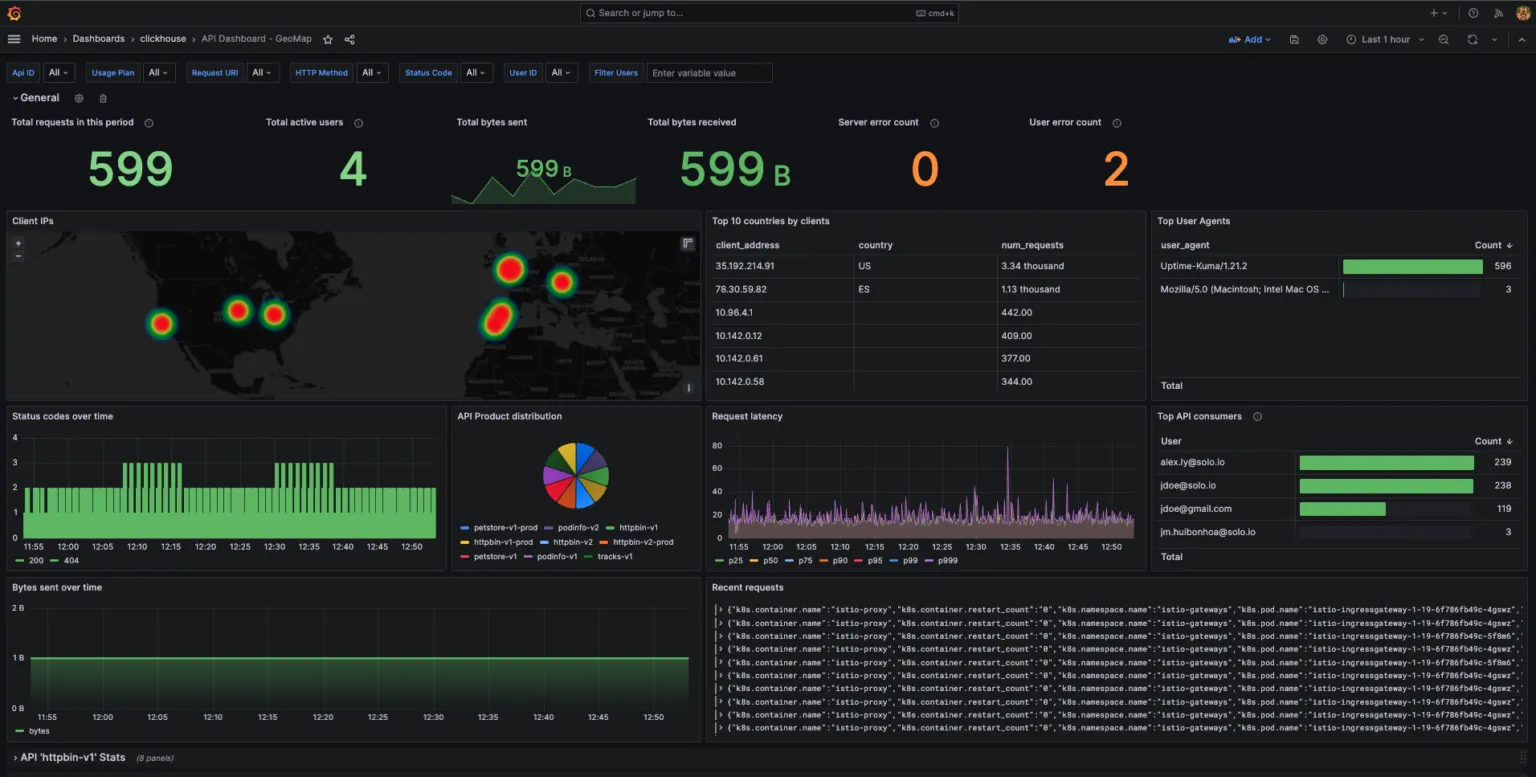
Seeing where (in terms of geographic location) you are receiving your requests from is invaluable to understanding the behavior and distribution of your users.
With this information, you can identify right away if:
- You are slower at serving requests in certain geographical locations.
- You are getting requests from locations where your service shouldn’t be available.
- Your WAF is not working properly.
And many more!
Now it’s much easier to determine whether you should look into using CDNs, support multi-regions, or fine-tuning your GeoIP-based WAF policies.
The possibilities are endless, but all come with the requirement of having the aforementioned geo-information available. Without that, it can be challenging to grep these kind of insights out of raw log lines.
Explore how you can easily attain that data in Gloo Gateway with the help of popular open-source projects like ClickHouse and Grafana.
Getting Started
First, make sure you have have followed the steps in our Gloo Mesh Gateway workshop right until the very end.
Note: you can achieve the same functionalities by making sure you have a ClickHouse database with IP addresses, and use that instead of gloo_api_logs.
Then, let’s take a look at the database and its content that we will use to map IP addresses to geo coordinates!
You should see a similar result after you click Run.

You can now see where IP ranges start and end, what’s the corresponding country code and state information, longitude and latitude, etc. Basically all the information we need is here.
Then, let’s create a new table with this GeoIP data!
Now you should have ~3M records inserted!

Formatting the Data
In ClickHouse, there’s a structure called dictionary that maps keys to attributes. These can be also updated dynamically, making them a perfect fit for our use-case.
Because ClickHouse’s ip_trie dictionary expects the data to be in CIDR notion, we have to convert the data we have, and do some preparation. Please see this page for more information!
Then ingest the rows!
You should have receive an OK. response.
Now, let’s finally create our dictionary that we mentioned!
If you run this query, you should have data formatted in CIDR notion.

After this, we can start to perform IP lookups. Let’s try it!
You should see the corresponding country code coming up.

Now, if you have followed all the previous labs, you should have logs with various IP addresses in gloo_api_logs table.
If you run this query, you should see the client IPs for your most recent API queries:
Here’s what I have in my case:

It’s possible that you only see an internal IP address here due to having proxies in front of your gateway.
To get the actual IP addresses, you have to specify the number of trusted proxies before your gateway pods.
To trust two proxies (that is common, when you are using a cloud provider’s load balancer in front of your gateway pods), here’s a patch that you can apply to your gateway:
Then you can apply it via:
Now, you can send requests again via the Gateway to populate the proper IP address to the access logs!
That Will Not Scale
Alright, now let’s plot all of our access logs over a GeoMap!
Hold on, let’s take a step back.
If you have a fairly popular service, visualizing all the requests can get quite expensive!
We can, however, use the built-in geohashEncode() function to hash the coordinates, aggregate them, and log10() normalize the data to show density in a scalable manner!
The final part of the query basically counts the number of records for each geohash (to get the “heat” or density of data points in that area), and calculates an adjusted heat value using the logarithm of the heat value. This adjusted heat value is used to create a heat map where areas with more data points have higher values, making it a perfect format to visualise with Grafana.
You should have a similar output like this:

Now, we can use this to power a Grafana dashboard to plot all the data over an actual map!

Try Gloo Gateway Today
As enterprises embrace cloud native technologies and seek modern solutions for API management, Solo.io’s Gloo Gateway emerges as a valuable choice. With its superior developer experience, streamlined operations, improved performance, and cost-saving advantages, Gloo revolutionizes the API management landscape.
The success stories that F100 financial services and telecom companies can demonstrate, coupled with the comprehensive feature set of Gloo, make it a worthy investment and a key driver of business growth in the cloud native era.
Shoutout to Zach Naimon for his blog post that was extensively used for this blog post.


%20a%20Bad%20Idea.png)


%20For%20More%20Dependable%20Humans.png)


